Become a Guest Blogger
- Become a guest blogger at The Linux Newbie!
- Just e-mail me with your idea and I will send you an invitation to sign up, it's that simple.
The Linux NewbieA Linux Newbie Helping Others Come Into The Linux World. |
|
When I first installed Kubuntu, I started right-clicking on everything... I especially wanted to know how to get all the cool apps on my taskbar that I had seen in other screenshots. Upon right-clicking on my taskbar I noticed something that said "Add Applet to Panel..." That sounded real promising, so I clicked and, alas, there appeared before my eyes a virtual cornucopia of little applets for me to add and remove, WOOHOO! And, since I love watching what my system is doing, I naturally picked "System Guard" for my very first app to add.
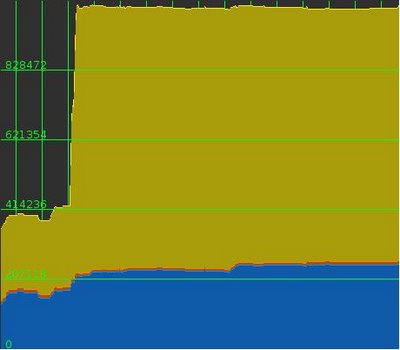
I ooo'd and aaaawe'd as I saw the pretty graphs stream across the bottom of my screen. However, one thing I noticed, and it seemed a little disconcerting to me, was the maxed-out colors on my memory graph. It seemed that all my memory was all used up, and as I moused over the graph it did not show the memory usage numbers. I felt I was at a dead end. Moreover, I was pretty sure, from all appearances, that KDE truly was a memory hog. But I had a lead; there were these mysterious words from my "mouse-over" that I wanted to understand, so I went about seeing what I could learn.
When I moused over the memory read-out, this is what I saw:
localhost:memory/physical/cachedI had no idea what these lines meant, so I Googled around seeing what I could learn, and found a few interesting articles. One that explained the Linux memory process very simply to me (the first part anyways) was in the Gentoo Forums (Gentoo is a Linux Distribution). Basically, here is the deal.
localhost:memory/physical/buf
localhost:memory/physical/application

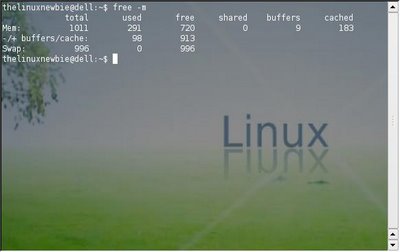
free -mJust bring up your terminal (Konsole in KDE) and type in the afore mentioned command, and you will get lots of fun stats on your memory.

 Digg It!
  del.icio.us
<< Home